In our first article in this series we set the scene and looked at the style and diversification aspect of building a portfolio. You can find the article here.
In this second article on Portfolio Construction we will delve into the two main risks faced by bond investors – the risk of not being paid back – or credit risk – and the risk of the market price of your bond investment moving due to
a change in the interest rate or yield of the bond – called interest rate risk.
With all risks, one of the difficulties investors face is how to measure them. A lot of the time, risk can only be reasonably measured by a set of assumptions, and then observing if those assumptions play out in real life.
A good example of this is in modern portfolio theory, where risk is measured as the volatility of the price of a particular instrument (usually a share). However, for bonds, where an investment can be held to a maturity date when capital is returned,
volatility can often have no meaning to an investor. This is due to there being no interest in selling the bond and the return of capital will come naturally at maturity.
This is one of the key differences to equity investing – as equity capital can only be returned by selling the particular share, and therefore volatility – or the probability of today’s price being the same tomorrow – is very important
as a predictor of the future capital value of the share.
Bond investors, assuming no default, have a natural future date when the value of their bond is known – the maturity value.
It therefore becomes more important for bond investors to understand the risk of them not being repaid – the credit risk.
Credit risk
Credit risk is ultimately an assessment of the individual investor – opinions can vary widely about the risk of a particular issuer about whether they will be able to repay the capital on the maturity date and pay the periodic interest payments.
However, with such a wide and varied market, and with not all investors possessed of the same level of credit analysis skills, having a somewhat standardised measure of credit risk is of use to investors.
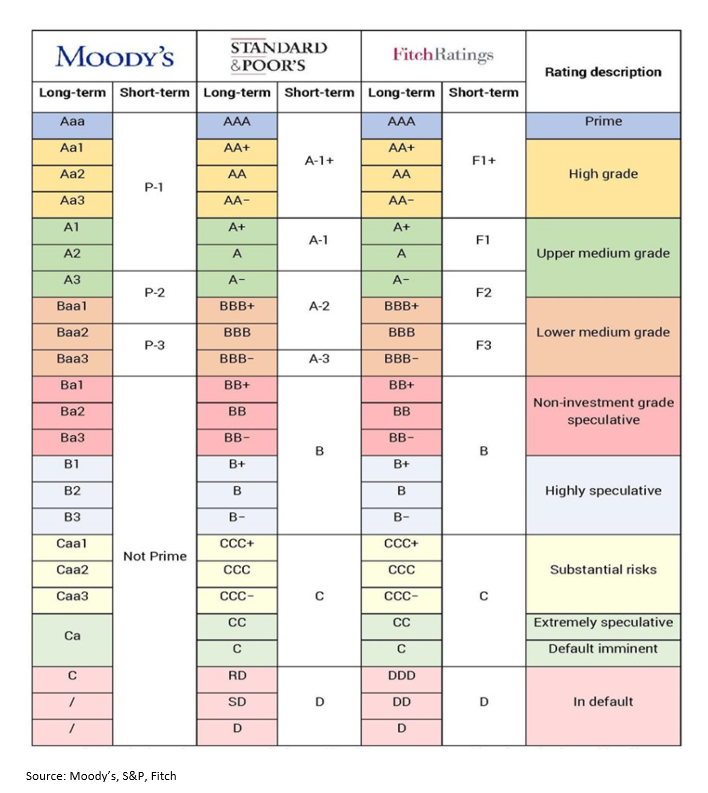
This is where the credit rating agencies come in. The two largest and best known are Standard & Poors (S&P) and Moody’s, and both produce credit ratings on an alphanumeric scale to represent their opinion of the risk inherent in a particular
bond. Fitch is also a well-known agency.

As bond investors with a typical multi-year time frame, we are usually interested in the long-term rating.
Quantifying the risk of each rating is the next challenge. What is the real difference between a BB rated or A rated bond?
Ratings are a combination of probability of default and likely recovery (i.e. loss given default).
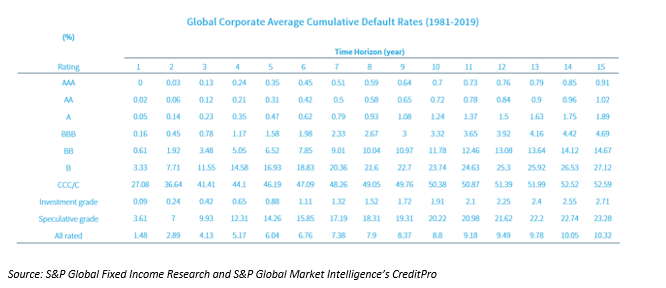
Each year S&P produce a Global Default Study, which examines the default history of every bond in their rating universe. This study has been running since 1981, so is a good long-term sample of the history of credit risk.
Whilst this of course cannot predict the future performance of a bond at a particular rating level, history can provide us with a strong guide to the likely outcome given the variety of conditions that have been experienced over the last 40 years.

There is a lot of information in this table, and the differences between certain ratings bands or time horizons can be very small.
Therefore, it is useful to focus on the main themes that the table shows.
Essentially, the risk increases from top left (high rating [AAA], short time horizon of 1-year) to bottom right (low rating [CCC], long time horizon of 15-years).
So, the longer the tenor on an investment the higher the likelihood of a default – which is why investors demand a higher return for a longer time period. A higher rating has also historically resulted in a lower instance of default.
Not all ratings are the same – there is a big difference between Investment Grade (the highest quality of issuer – AAA to BBB- ratings) and Sub-investment or Speculative grade (BB+ or lower ratings).
Take the 5-year tenor for example – a relatively standard time horizon for a bond investment.
For all investment grade issuers, the historical incidence of default is 0.88%. Another way of looking at this is that 99.2% of all investment grade bonds paid their coupons and principal on their due dates. The difference between AA (0.31% defaults)
and BBB (1.58%) is very small. This should give investors in investment grade rated bonds a high level of confidence in being repaid.
However, once you move into sub-investment grade then the ratings make a much larger difference. From BB (6.52%) to CC (46.19%), the increase is an approximately seven times higher incidence of default, with nearly half of CCC rated bonds having historically
defaulted in 5 years. Even at a short one-year tenor, this is a huge 27%. Therefore, the risk involved in investing in CCC rated bonds is hugely different to BB rated bonds, despite both being sub investment grade.
It is also important to note that a default in itself might not result in a loss to the investor. This data measures only the event of default itself. For example, secured investors may get a 100% recovery in the event of a default by the issuer as a
whole. Loss given default is the important next metric, but as this is very individual to the particular situation and can be litigated for years, there is no definitive data.
Interest rate risk
Interest rate risk is the risk that the price of the bond moves due to a change in the yield of the bond. As bonds are at their essence just a series of discounted cashflows, this is actually relatively easy to calculate, and in fact a standard measure
exists to quantify this risk.
Modified (or Macauley) Duration is a calculation that shows the sensitivity of the price of a bond to a 1% movement in its yield.
This is particularly relevant to fixed rate bond holders, as the yield is essentially the discount rate used to determine the present value of all of its cashflows. The longer the time period over which the cashflows are discounted, the larger the impact
of a movement in this discount rate, or yield.
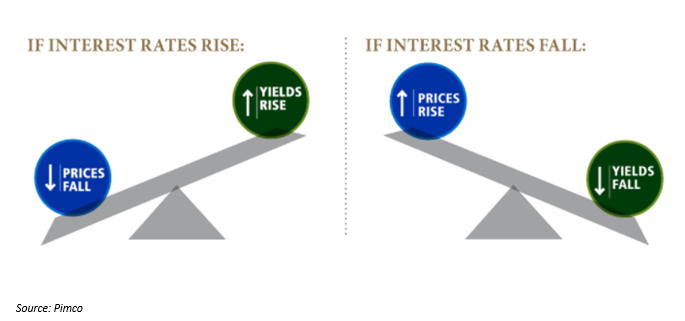
The other key thing to note is the inverse relationship between price and yield. That is to say that when yields rise, prices fall and vice versa.

Floating rate bonds are less affected, as they reset their cashflows every month, quarter or half-year depending on the terms, making their interest rate duration usually very short. This is even though they may have longer maturities.
Bonds with lower coupons are also more affected, as more of the present value is represented in the final maturity payment, as lower amounts are received throughout the life of the bond.
This can expose inexperienced investors to risks they may not necessarily appreciate, particularly with government bonds. As the lowest risk bonds in the market, Australian Government bonds are rated AAA, and therefore also carry the lowest coupons for
their tenor as they are assumed to have zero credit risk (hence the highest rating).
Therefore, an investment with supposedly no risk (this is technically correct – there is assumed to be no risk to repayment, i.e. credit risk) can actually, in the wrong market conditions, leave investors facing a large paper loss, or even an actual
one if they become forced sellers prior to maturity.
Ironically, high yield bonds with sub investment grade ratings can actually carry less interest rate risk than higher grade bonds, as they typically have higher coupons, which lowers their duration.
Conclusion
It is important to consider both credit and interest rate risks when investing in bonds, as both are relevant to the performance of the bond.
Credit ratings give a great starting point to begin the evaluation of a credit risk of a bond and the likelihood of default, although investors should not rely exclusively on them as they do change over time. As investors into CDOs found in the GFC, they
may not always fairly represent the risks (although to be fair the agencies have learned a lot since then).
Interest rate risk can be a more powerful influence on the price of a bond compared to the credit risk, as investors in government bonds should know.
In general, these risks tend to offset one another in corporate bonds, as when market interest rates rise, conditions are usually more benign which results in a lowering of the premium investors demand to take credit risk. These balancing factors tend
to make bond prices relatively stable, except for periods when outsize moves in one or the other take precedence.